
You've built a Forge app, you've listed it on the Marketplace, and customer installs are rolling in. What comes next? The ability to monitor app performance and access production logs is a fundamental capability for running business-critical apps. Until now, Forge's monitoring capabilities have been limited. Now, developers have access to log sharing, new insights and metrics and basic alerts, which reduces the time it takes to become aware of and resolve app issues.
Being able to monitor your app is critical to maintain and continuously improve your app's health and performance. That's why over the last several months, we've released enhancements to the Forge developer console to give Forge app developers increased transparency into customer invocation success and failures with their apps. We're just getting started, and there are many more improvements still to come on our roadmap.
Read on to hear a round-up of Forge app monitoring capabilities that have been released so far, and watch a demo of these new enhancements in action to discover how you can best leverage app monitoring to support your customers.
1. Frictionless log sharing
Troubleshooting and debugging customer issues in your app begins with gaining access to logs. Previously, gaining access to logs required walking customers through the process of enabling log sharing — which was challenging and time consuming for both partners and customers. In order to reduce this friction, we recently announced that logs for your Forge app are enabled by default for all new installations, bringing the experience closer to the level of logs access you currently have with your Connect apps.
The biggest game changer has been the fact that new installs have by default shared the logs with us. Any new installations that have issues, I am very sure that we can and will be able to help [our customers].
Sue Rocha, Mibex Software
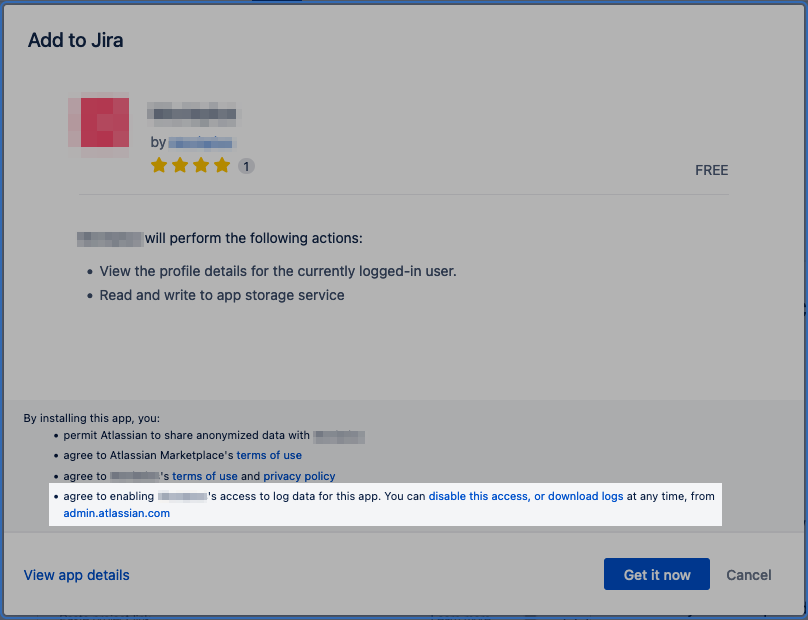
By shifting to an opt-out approach, you should see a significant increase in the number of users sharing logs, making it much easier and faster to troubleshoot issues as well as match spikes in errors with corresponding log messages. Customers will see the below message while installing the app, and those who do not want to share their logs can still choose to disable log access after they have installed the app.
Although you're able to access logs for both Connect and Forge apps, this new experience for accessing logs and giving customers who are sensitive to data egress control over access to logs is unique to Forge apps, and it is easily controllable and modifiable in the admin hub. Your app users can check the content of their logs at any time to provide peace of mind and feel confident about what is being shared. Logs can contain sensitive information, and Atlassian provides recommendations for properly handling log data in our logging guidelines. We encourage you to take this into consideration when creating your privacy policy.
Although this update does not include log sharing for existing customer installations, this is a step in the right direction, giving you more information to troubleshoot issues without the need to manually enable log sharing customer-by-customer. Partners we’ve spoken to have called it the “biggest game changer so far” in allowing them to better help their app customers.
2. New insights from metrics in the developer console
In order to provide faster time to resolution for your customers, you need more than just access to logs. It's important to have performance metrics that you can aggregate and analyze across your entire install base or see spikes and dips related to each individual site. Within the Forge developer console, you're now able to analyze metrics related to your app's health and performance. You can more easily pinpoint the errors your customers are running into with your app, and resolve problems before customers contact you about them by refining what is displayed on the dashboard by site, app environment, or date.
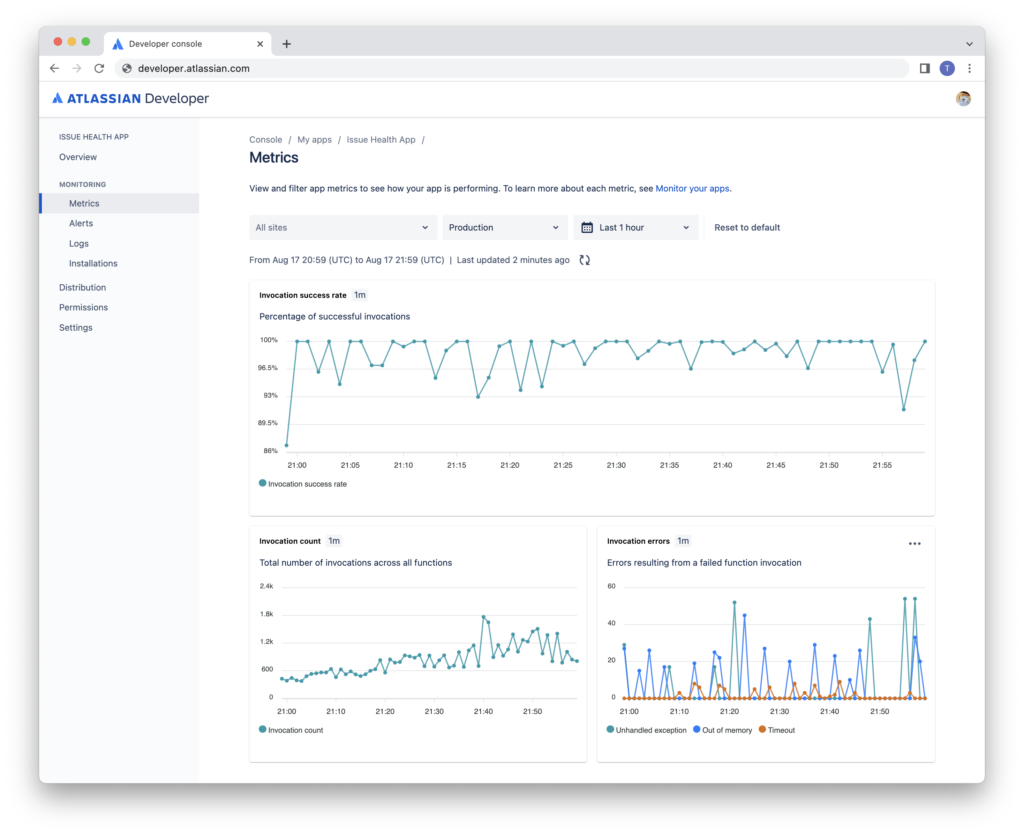
In order to check things like invocation success rate, invocation count, and invocation errors (broken out by error type), the Forge developer console provides you with a metrics dashboard that surfaces data aggregated from every site your app is installed on that has been active in the last 14 days.
From the very first time we had a look at the metrics they were valuable to us. Through the metrics dashboard we discovered we were hitting a storage limit. We've since spoke to the Forge storage team and they've raised the storage limits to alleviate this problem for us. Of course I would still want more and more [metrics] but admittedly that was already extremely helpful and fantastic.
Oliver Siebenmarck, Polymetis Apps
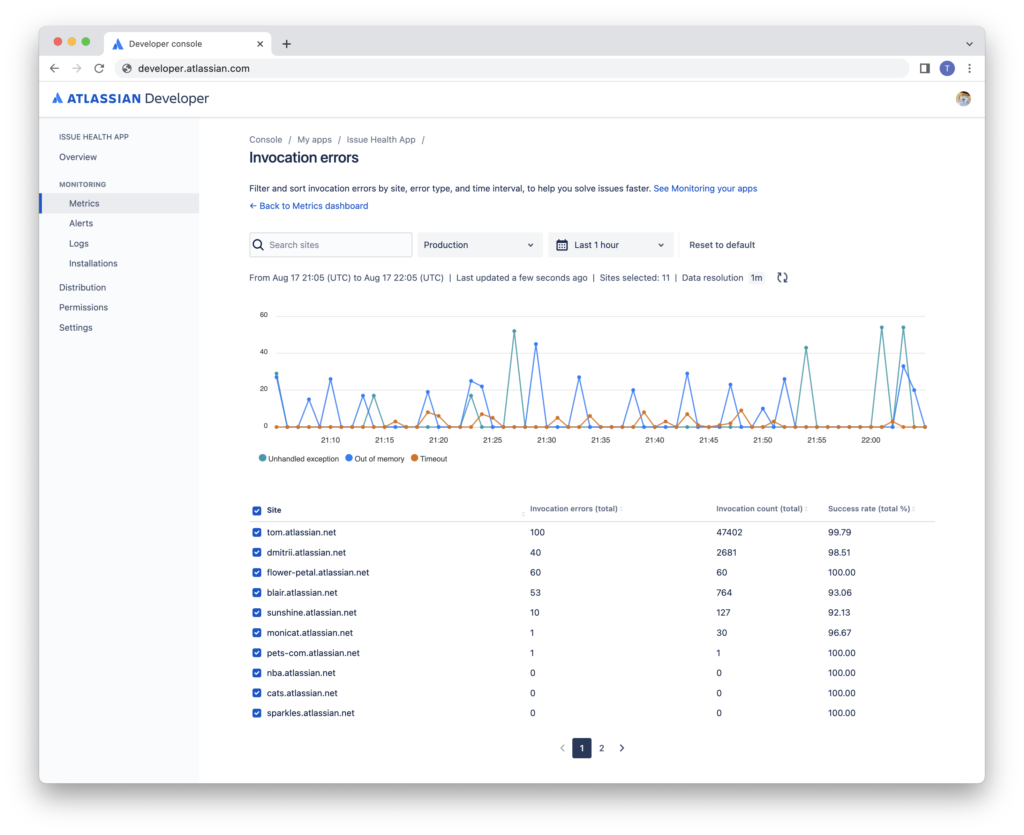
To take it a step further, you can also dive deeper into invocation errors in order to search, filter and sort data to identify errors across specific sites and installations. This helps you conclude how active your users are in each site. From this data, you can conclude if certain sites are experiencing a higher number of errors.
Having access to invocation metrics can empower you to take proactive measures to resolve potential app issues before getting a flood of emails in your inbox from customers reporting that they're experiencing problems with your app. The metrics dashboard provides you with a high level view of the overall experience your customers are having while using your app.
While these metrics will be helpful, this is just the start. Members of the early access program have provided us with some excellent feedback regarding filtering metrics, and we hear you! A few ideas we are researching include: Configuring the threshold for alerts or improving the way log messages are displayed. We're taking note of your suggestions and as we continue to build out new functionality, we're looking at how we can integrate your feedback into our roadmap to improve how you view and filter Forge app metrics.
3. Keep a pulse on app performance
Because no developer has their Forge console open 24 hours a day, we've also added proactive alerts so that you never miss a beat when it comes to dips or spikes in app performance with new alerting capabilities built into the developer console. With alerts, you'll know right away when your customers are experiencing issues with your app whether you're at your computer or on the go.
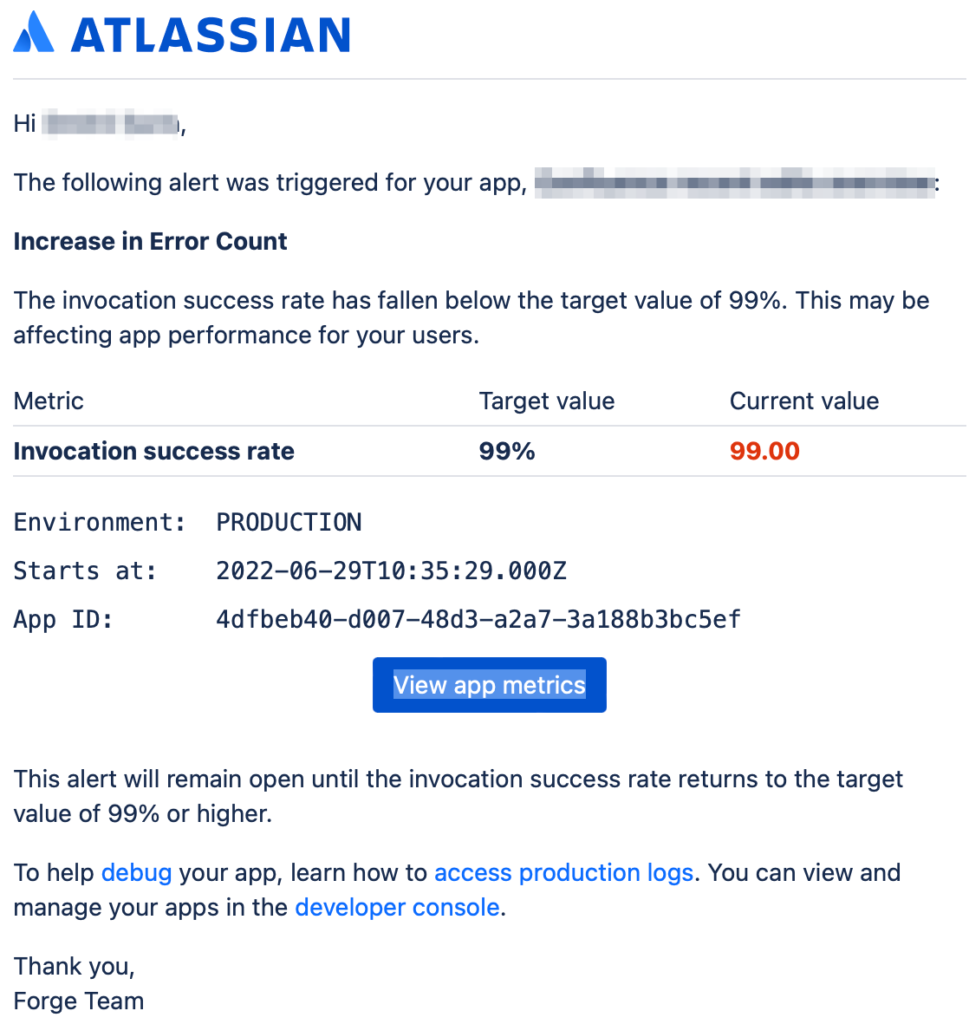
With this recently released functionality, any time your Forge app invocation success rate dips to 99% or below across all sites for at least 5 minutes a message will be sent to the app owner's email to alert them of a drop in the success rate so that you're kept aware of potential problems that arise.
In future releases, we plan to add certain capabilities like being able to change the metric threshold. We're just getting started with alerts and looking forward to hearing your feedback on what you'd like to see next with alerts on the developer community.
See app troubleshooting in action
Want to see all of these enhancements working together in a real-life example? Watch a member of our Forge engineering team, Dmitrii, walk through how he uses new monitoring capabilities to troubleshoot errors in his own Forge app.
Looking ahead
We're looking forward to bringing you more monitoring updates in the next several months. These include:
- Being able to group metrics by app version
- Adjusting the threshold for Forge app alerts
- Filtering the logs in the developer console by log level
We'd love to hear how you're using these new improvements to app monitoring and what you'd like to see next, so let us know your thoughts in the Developer Community!