
This post is the first part of a series on how we built Bitbucket Data Center to scale. Check out the entire series here
Today is Bitbucket Data Center’s second birthday! It really was two years ago that Stash Data Center 3.5 (as it was then called) became the first collaborative Git solution on the market built for massive scale.
On the day it was born, Bitbucket Data Center had just 7 customers (who had worked with us throughout the development and pre-release phases), and a small handful of add-ons whose vendors had made sure their products had already earned the Data Center compatible badge on day one.
Since those humble beginnings, Bitbucket Data Center has changed its name and experienced enormous growth in adoption, functionality, and deployment flexibility. Some highlights we’re particularly proud of include
- Hundreds of thousands of users worldwide.
- Over 100 Data Center compatible add-ons in Atlassian Marketplace.
- Smart Mirroring, enabling large enterprises with teams around the world (but less-than-stellar network connections) to enjoy
git cloneandgit fetchjust as fast as local offices. - Disaster Recovery and integrity checking, providing peace of mind for large enterprises that their repository data will always remain safe and available.
- The Amazon CloudFormation template and Quick Start guide, taking the hassle out of deploying Bitbucket Data Center in the Amazon Web Services (AWS) environment and taking advantage of its managed services and auto-scaling capabilities.
- And most recently, SAML support, enabling single sign-on for Bitbucket Data Center users across not just Atlassian products but all SAML-compatible products used by your development teams.
But the number one feature provided by Bitbucket Data Center since the beginning — and still the primary reason why many customers adopt it — is performance at scale. Large enterprises with thousands of active users and build agents hitting their central Bitbucket instance can’t serve all their load with a single machine. Instead, sysadmins must use the scale features of Bitbucket Data Center to handle heavy loads without sacrificing performance for their users.
To celebrate Bitbucket Data Center’s latest milestone we’ll describe some of the work we’ve been doing – behind the scenes – to make Bitbucket Data Center the first massively scalable Git solution and still the leading and most performant product available today.
The scaling challenge
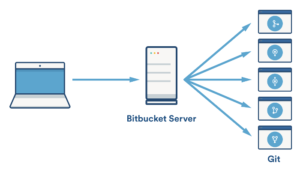
When it comes to scale, the most demanding load many Bitbucket instances deal with is managing Git hosting requests (simultaneous user-initiated commands, like git clone, fetch, push, and so on).
This is because when you run a Git command that must communicate with a remote repository on Bitbucket, your Git client opens one or more connections to your Bitbucket instance (depending on whether you are using HTTP or SSH). When each of these connection reaches the backend server, after authentication and other processing, the connection spawns a Git process and streams its standard input, output, and error output back to the client.
These Git processes on the server are CPU and memory intensive, especially when they generate packfiles to transfer repository contents over the network. By comparison, most other kinds of operation you can perform against a Bitbucket instance (like browsing around, interacting with pull requests, and so on) are generally much lighter and faster.
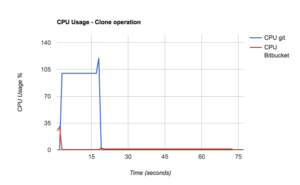
These graphs of the CPU and memory usage of a typical git clone operation on a server might help to illustrate just how resource intensive Git hosting operations can be. The blue lines shows the resource consumption of the Git process alongside the red lines representing that of Bitbucket. Bitbucket does a bit of work when the connection comes in and then hands it off to Git, using very little CPU itself. The first thing Git does is create a packfile, consuming about 100% of a CPU core for a while, then it does some compression which consumes even more (Git is multi-threaded). Its memory consumption also climbs during these phases, often by a few hundred MBytes or more. After the packfile has been generated, streaming it back to the client uses hardly any CPU in Git or Bitbucket, but the memory allocated by Git isn’t released until the request has been fully served and the process exits.
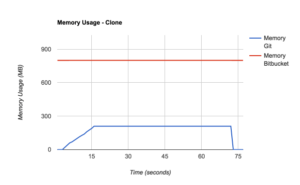
The resource consumption of just one git clone may not seem so bad, but when you have hundreds or thousands of users doing these operations concurrently, the CPU and memory usage add up quickly.
Continuous integration systems like Bamboo and Jenkins are also famous (or, perhaps, infamous) for making very many Git hosting requests against a Bitbucket instance, to clone and fetch from (and sometimes also push to) repositories for builds and tests. Load from build agents tends to come in bursts: builds configured with many parallel or cascading stages can generate massive “storms” of Git hosting operations all at once. Many continuous integration systems (like Elastic Bamboo) can also spin up large numbers of elastic build agents in a cloud environment like Amazon EC2. This can provide vast amounts of CPU resources in a short time to get through the build queue, but can overwhelm a Bitbucket instance that’s not provisioned with enough resources to handle the peaks.
Horizontal scaling
If you have a standalone Bitbucket Server instance, the only approach available to you to handle the sharp spikes in load (for instance, from CI systems like Bamboo or Jenkins) is to buy a bigger machine, with more cores and more memory. Scaling up your instance “vertically” like this certainly does work, up to a point. But there’s a limit on how far you can scale with one machine, and putting “all your eggs in one basket” by buying one very large (and often very expensive) high end machine isn’t always a good idea.
With Bitbucket Data Center, though, you have another option: you can also scale your instance out “horizontally” by adding machines to form a cluster of many nodes, behind a load balancer.
Bitbucket Data Center co-ordinates all the machines in the cluster seamlessly, making it appear externally as one single instance of Bitbucket (only larger). It’s very easy to add new nodes to the cluster at any time, even while it’s running. Every node you add scales up the amount of CPU and memory resources available for both Bitbucket and Git. The more CPU and memory resources you have, the greater the capacity of your instance to handle load before performance starts to degrade.
The Elastic Experiment Executor (E3)
At Atlassian we run a busy production Bitbucket Data Center instance of our own that hosts nearly all of the repositories used by our dev teams. Atlassian’s build engineering team is always looking for ways to improve performance and regularly ask about scenarios that would have a drastic impact on performance.
_”What if we added another 300 build agents to one of our Bamboo instances?
Will Bitbucket be able to cope? How many more nodes would we need?”_
Naturally, the answers depend on many variables. Until recently our approach to capacity planning was to initially deploy a few (usually two) reasonably large nodes. Once we noticed performance degradation during our busiest times we would ask IT to provision another node. This approach works (to a point), but is far from ideal. Because, while we do proactively monitor the load and response times in our production instance, it can take some noticeable performance degradation (and some unhappy users complaints) before any action is taken. In addition, while we wait for IT to provision some new hardware, our coworkers could be left twiddling their thumbs waiting for Bitbucket to respond and their builds to run.
We eventually needed something more scientific than the “try it and see” approach, so we wrote a performance testing tool that let us spin up any configuration of Bitbucket, throw a repeatable workload at it of any desired size and shape, and observe its throughput, response times, and other vital statistics while it runs. This tool eventually became known as the Elastic Experiment Executor (or E3 for short).
Not only does E3 let us measure the performance of different hardware configurations, it also allows us to take different versions Bitbucket, or instances configured with different options, and compare them side-by-side. After only a few hours the tool gives us accurate performance data that used to take days or even weeks for someone to crunch out manually. With E3, developers also have an easy way to run controlled performance experiments on their local changes before they merge them to master, so our teams has better data, and much more confidence about that data, that each new version of Bitbucket will perform as well or better than its predecessor before we roll it out to our production environments.
For an example of the kind of performance data we can get using E3, here’s a chart of the overall throughput of eight different Bitbucket instances (with cluster sizes ranging from 1 node to 8 nodes) under ten different load levels.
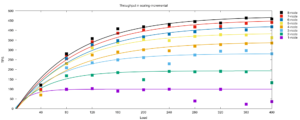
This chart shows Bitbucket Data Center’s actual sustained tests per second (TPS) performance in 80 separate test stages, each one representing a different cluster size and load level. A “test” here means any operation (such as a git clone, loading a page, or hitting a REST endpoint) successfully executed against the Bitbucket instance under test. The operations are taken from a typical mix of interactions including Git hosting operations, browsing, interacting with pull requests, and so on.
E3 also produces charts that show the breakdown of individual operations in the workload mix visually, and how much each one contributed to the overall “TPS” value.
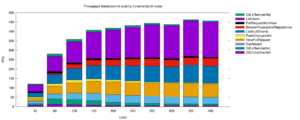
To put a Bitbucket instance under enough stress to reach its capacity limit, you generally need to generate load from a cluster of many client machines, each running many threads, with each in turn doing many operations back to back: and this is what E3 provides automatically. (This particular test used 10 high end machines running up to 400 client threads, which is the kind of workload that 20,000 – 40,000 typical users and build agents would generate in a busy period.)
Charts like this don’t only show how Bitbucket Data Center’s capacity scales horizontally out to 8 nodes on this particular infrastructure. They also give us an easy way to estimate the maximum capacity that a clustered instance with a given number of nodes can sustain before response times start to suffer. And suffer they do, as the following E3 chart from the same experiment shows.
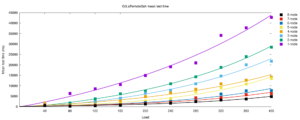
Experiments like these also give us confidence that the Bitbucket application itself and other infrastructure (database, file server, network, OS, and so on) it’s deployed on don’t have hidden bottlenecks that might limit the capacity and scalability of a very large cluster.
You might wonder where E3 gets the wherewithal to provision eight real Bitbucket Data Center clusters and eight client clusters, consisting of more than 100 machines, together with databases, load balancers, and all the rest. Atlassian’s performance engineering team does operate a “modular performance lab” with racks of high end, bare metal machines which we have sometimes used for such testing. But when we really need large numbers of machines at short notice for tests like this, we usually go straight to Amazon EC2. EC2 lets us quickly spin up topologies of machines with different sizes and shapes (i.e, balances of CPU, memory, and I/O) for specific performance tests, far faster than we could ever do with physical machines. E3 has the capability to provision any or all of the resources it needs, both the instances under test and the client workers, in EC2 using Amazon CloudFormation templates with any desired combination of parameters.
E3 is easy for developers to use: All we need to do is define our “experiment” in a JSON formatted file. Then with one command, E3 can spin up all the machines it needs in Amazon, run all threads of the experiment in parallel, download the results and statistics (gathered with collectd) off the machines, analyze them, and finally tear all the instances down again when their work is done.
We’ve made the complete source code to E3, as used by Atlassian’s development team, publicly available here:
https://bitbucket.org/atlassian/elastic-experiment-executor/
The experiment file we used for the above charts can be found in E3‘s standard experiment library, called horizontal-scaling.json. For any of the E3-based performance charts in this series, you can go and check out the corresponding experiment from this repository and not only see our exact methodology, but (if you have enough machines of your own or are willing to spin some up in AWS) can even run the same experiment for yourself and reproduce similar results for your own infrastructure.