

This blog post was contributed by Ihor Uksta, a software engineer at iDalko.
As test management gets more complex, developers need a way to highlight specific aspects of code which may not be adequately reviewed and require additional testing. Code Coverage is a metric that measures what percentage of your code has been executed during unit and integration tests.
JaCoCo is a great open-source toolkit for code coverage measurements. JaCoCo was originally written for Java and runs on the JVM, but because it's bytecode-based it works for Scala too. It also includes reports which can be extremely helpful when working with complex projects.
In this post, we're going to look through some practical examples of code coverage analysis via JaCoCo by using sbt-jacoco as an sbt plugin.
How JaCoCo works to measure code coverage
JaCoCo supports a number of different metrics for code coverage measurement:
- Instructions: provides information about the amount of code that has been executed or missed.
- Branches type: calculates coverage of decision points and conditional logic. It measures which decision outcomes have been tested or which of these branches were missed.
- Cyclomatic Complexity metric: measures the cyclomatic complexity of each method. This metric is used to indicate the complexity of the code. The complexity value can serve as an indication of the number of unit test cases needed to fully cover a certain method.
- Lines: reflects the percentage of lines of code that have been executed.
- Methods type: calculates the number of non-abstract methods that have been executed. A method is considered executed when at least one instruction has been executed.
- Classes metric: is on a higher level to Methods one. A class is considered executed when at least one of its methods has been executed.
How to generate JaCoCo reports
JaCoCo’s build runs all the tests in a system, and then after the build is terminated, it generates a report file. The reports are published in the directory /target/scala-{version}/jacoco.
Each metric mentioned above can be represented in a report as a percentage of the covered code. Additionally, some types are also visually highlighted:
- Branches:
- No coverage: No branch on the line has been executed (red diamond)
- Partial coverage: Only a part of the branches on the line have been executed (yellow diamond)
- Full coverage: All branches on the line have been executed (green diamond)
- Lines:
- No coverage: No instruction on the line has been executed (red background)
- Partial coverage: Only a part of the instruction on the line has been executed (yellow background)
- Full coverage: All instructions on the line have been executed (green background)
JaCoCo can generate reports in the following formats:
- HTML – Visual report for end users.
- XML – Designed for further processing by other external tools.
- CSV – Basic report type suitable for creating graphs.
How can you use JaCoCo with SBT?
Adding JaCoCo to your Scala project appears to be very simple with an sbt-plugin called sbt-jacoco. First, you just need to add the plugin to your plugins.sbt:
plugins.sbt
addSbtPlugin("com.github.sbt" % "sbt-jacoco" % "3.0.3")Then run a command: sbt jacoco
This command runs all your unit tests and collects code coverage metrics into an HTML report. The report can be found in the /target/scala-{version}/jacoco/report/html/index.html.
In the logs you can get a short overview of the analysis:
| [info] ——- Jacoco Coverage Report —— [info] [info] Lines: 0% (>= required 0.0%) covered, 0 of 0 missed, OK [info] Instructions: 0% (>= required 0.0%) covered, 0 of 0 missed, OK [info] Branches: 0% (>= required 0.0%) covered, 0 of 0 missed, OK [info] Methods: 0% (>= required 0.0%) covered, 0 of 0 missed, OK [info] Complexity: 0% (>= required 0.0%) covered, 0 of 0 missed, OK [info] Class: 0% (>= required 0.0%) covered, 0 of 0 missed, OK |
In this case, I have zeros everywhere because the project is completely empty, so we need to add some logic there. Let's take a look at this quick and dirty example in Scala:
package example.jacoco.beer

object BeersSeller {
  def getBeer (age: Int) : String = {
    if (age < 18) "No beer" else "Beer for you"
  }
}
And the executor will be a simple main function:
package example.jacoco.main

import example.jacoco.beer.BeerSeller
object Main {
  defmain (args: Array[String]) : Unit = {
    println (BeerSeller.getBeer(20))
  }
}
We should cover this with unit tests. We need to add a scalatest library to our build.sbt:
build.sbt
libraryDependencies += "org.scalatest" %% "scalatest" % "3.0.1" % "test"
And unit test itself:
import exampl.jacoco.beer.BeerSeller
import org.scalatest.{FlatSpec, Matchers}

class BeerSellerSpec extends FlatSpec with Matchers
{

  "BeerSeller" should :sell beer to an adult" in {
    BeerSeller.getBeer(20) shouldBe "Beer for you"
  }
}
After adding this code our report should look like:
| [info] ——- Jacoco Coverage Report —— [info] [info] Lines: 50% (>= required 0.0%) covered, 3 of 6 missed, OK [info] Instructions: 43.48% (>= required 0.0%) covered, 13 of 23 missed, OK [info] Branches: 50% (>= required 0.0%) covered, 1 of 2 missed, OK [info] Methods: 50% (>= required 0.0%) covered, 2 of 4 missed, OK [info] Complexity: 40% (>= required 0.0%) covered, 3 of 5 missed, OK [info] Class: 50% (>= required 0.0%) covered, 1 of 2 missed, OK |
As we can see our Branches coverage reached 50% and 1 out of 2 missed. Let’s check the HTML view report.
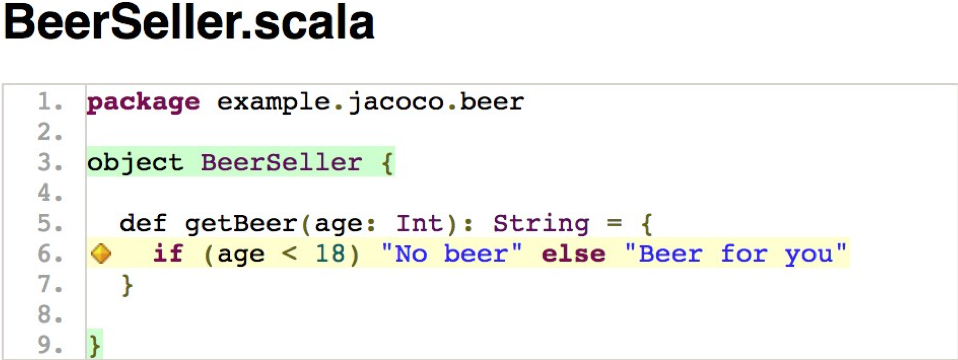
Based on the yellow diamond we know that only a part of the branches on the line have been executed. We need more tests:
import example.jacoco.beer.BeerSeller
import org.scalatest.{FlatSpec, Matchers}

class BeerSellerSpec extends FlatSpec withMatchers
{

  "BeerSeller" should "sell beer to an adult" in {
    BeerSeller.getBeer(20) shouldBe "Beer for you"
  }

  it should "not sell beer to a kid" in {
    BeerSeller.getBeer(4) shouldBe "No beer"
  }
}
Try it one more time:
| [info] ——- Jacoco Coverage Report —— [info] [info] Lines: 50% (>= required 0.0%) covered, 3 of 6 missed, OK [info] Instructions: 52.17% (>= required 0.0%) covered, 11 of 23 missed, OK [info] Branches: 100% (>= required 0.0%) covered, 0 of 2 missed, OK [info] Methods: 50% (>= required 0.0%) covered, 2 of 4 missed, OK [info] Complexity: 60% (>= required 0.0%) covered, 2 of 5 missed, OK [info] Class: 50% (>= required 0.0%) covered, 1 of 2 missed, OK |
Finally, our Branches are 100% covered.
But we still did not reach this number with our types. It’s because our project has a Main object which is just an executor of BeerSeller. In this case, we can exclude it from JaCoCo measurements by adding a more specific config.
build.sbt
lazy val excludes = jacocoExcludes in Test  :=Seq(
  "example.jacoco.main.Main*"
)

lazy val jacoco = jacocoReportSettings in test  :=JacocoReportSettings(
  "Jacoco Scala Example Coverage Report",
  None,
  JacocoThresholds (branch = 100),
  Seq(JacocoReportFormats.ScalaHTML,
JacocoreportFormats.CSV),
  "utf-8")

val jacocoSettings = Seq(jacoco, excludes)
lazy val jse = (project in file (".")) .settings
(jacocoSettings: _*)
Here we set a new name for the report, a required level of Branches metric, and add one more report format – CSV (and of course, exclude Main object from code coverage analyzing).
Now the report looks perfect:
| [info] ——- Jacoco Coverage Report —— [info] [info] Lines: 100% (>= required 0.0%) covered, 0 of 6 missed, OK [info] Instructions: 100% (>= required 0.0%) covered, 0 of 12 missed, OK [info] Branches: 100% (>= required 0.0%) covered, 0 of 2 missed, OK [info] Methods: 100% (>= required 0.0%) covered, 0 of 2 missed, OK [info] Complexity: 100% (>= required 0.0%) covered, 0 of 3 missed, OK [info] Class: 100% (>= required 0.0%) covered, 0 of 1 missed, OK |
Conclusion
JaCoCo and other code coverage measurement tools are great to have in your developer’s toolset, and it only takes a minute to install the plugin using sbt. Your reports will generate automatically while your unit tests are running, saving you time instead of waiting for your test results. The ability to see highly detailed visible reports is also a great way to make sure your code is better covered and fully tested.
However, you should always remember that 100% code coverage does not necessarily reflect effective testing—it only reflects the amount of code executed during tests.
To check out the example code used in this article, check out the GitHub repository here.

Ihor Uksta is a software engineer at iDalko, a Platinum Atlassian Solution Partner. He is currently leading the development of Table Grid for Jira. Every day he pushes to reach new heights with the next incarnation of this successful product.
When he is not improving the world with his magical strokes of Scala, he is discovering the better parts of Lviv with his bulldog Chester.