

It's a well-known fact that continuous testing is a strong predictor of successful delivery. While a lot has been written about CI/CD processes, there is less information available online about a specific type of testing: Post-Deployment Verification (PDV).
PDV is an end-to-end test that runs against an environment, simulating a user's behavior and verifying whether a feature or user flow is working as intended. It lets you catch issues right after deployment, before a customer encounters them, and it provides a strong, automated foundation for implementing CI/CD processes.
We use PDV daily at Move Work Forward (MWF). As a Platinum Atlassian Marketplace Partner that develops applications for Atlassian and Microsoft Marketplaces, we help teams "move work forward" by integrating Atlassian products with Microsoft Teams, Slack, GitHub, Azure DevOps, and more.
In this tutorial, we'll take you through our experience setting up PDV testing for Atlassian apps, guiding you through our process and sharing some of the challenges we encountered.
What You'll Learn by Following our Journey
The goal of PDV is to quickly and objectively verify that a particular functionality or feature of the app is running as expected. PDV tests can be run after code changes or on a schedule and can emulate end-user behavior. In this tutorial, you'll learn how to do just that: run UI end-to-end PDV tests on the core functionality of a 3rd party web app that exists on multiple domains (Atlassian, Microsoft) and is bounded by iframes. We'll be showing screenshots of our app, Advanced Microsoft Teams Jira Connector.
We'll cover:
- Choosing the most suitable visual testing framework for you and your end-to-end tests
- Configuring the project for tests, and writing test cases
- Understanding test architecture: How to make tests reusable, maintainable, and work well together in a system
- Learning about remote test execution (when and where to run tests)
- Preparing environment data
- Debugging and tracing

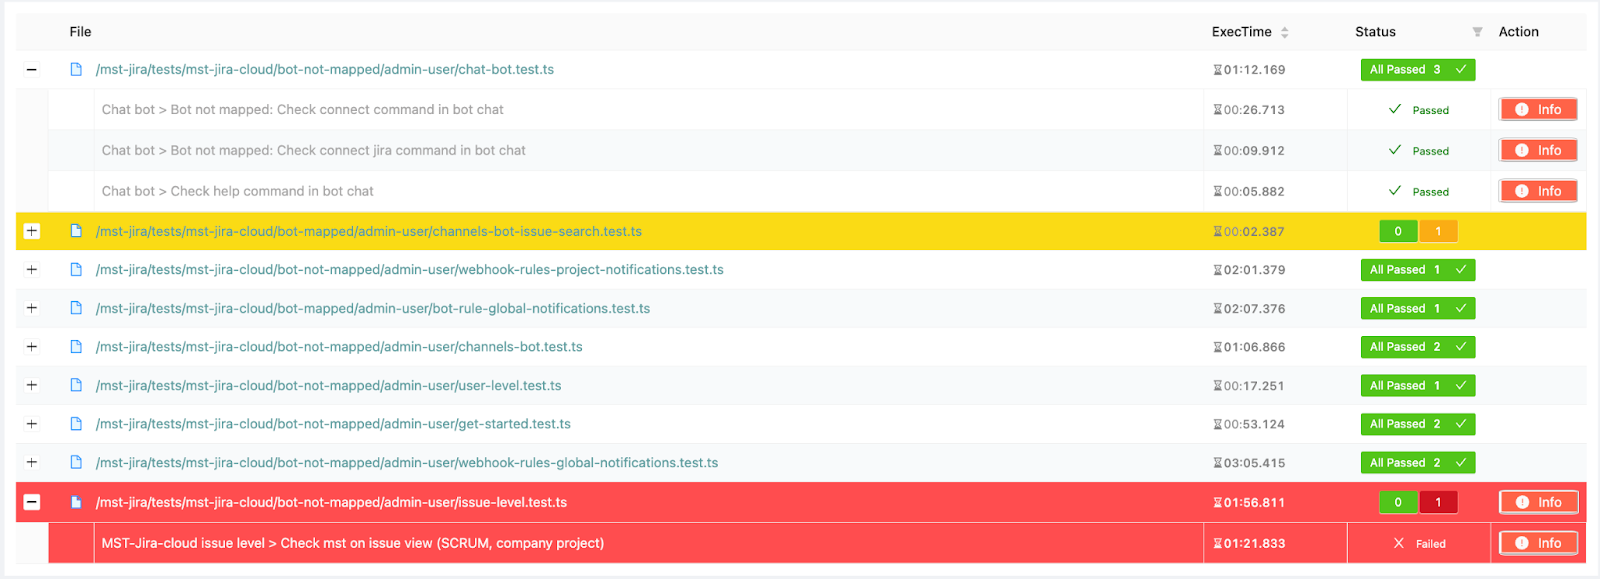
← By the end, you'll see all our tests look just like this!
Expected Outcome
For our app, we wanted the test suite to show "Success" (not "Failed"!) against a particular environment when we deployed to Test or Prod. That's right, PDV tests against the production environment, too!


1. Picking a Testing Framework and Language
At Move Work Forward, we have a lot of tests already written in Cypress, a front-end testing tool for browser-based applications. However, we discovered while writing end-to-end tests for our plugin that Cypress wasn't necessarily the best choice for everything. For instance, it's not suitable for:
- Working with third-party web applications
- Applications with nested frames
- Applications with additional security checks;
- For tests between multiple domain pages (Atlassian, Microsoft)
Instead, after some research we selected a better testing framework and stack for our use case: writing Node.js/TypeScript using Playwright.
Playwright is fairly new, and the small community and limited documentation can be an issue for advanced use cases, but it shows great promise, especially for something like the scope of this article. It's impressively good across multiple domains and pages, including iframes, and is much faster than Cypress.
It also supports the most popular programming languages ( JavaScript/TypeScript, Java, Python, and .NET) and is quite similar to the popular framework Puppeteer, which makes it more accessible to a broader cross-section of developers.
We use Jest to execute all types of tests, including end-to-end and unit tests.
2. Configuring the Project and Writing Tests
The next step was to configure the project and then start writing some tests. As always, preparation is the key to success, so concentrating on configuration always pays off in the long run.
We used the following tools:
- jest-playwright – integrates Jest and Playwright
- expect-playwright – provides useful expect statements
- Jest – provides the testing suite
- ts-jest – provides support for TypeScript
If you want to try this yourself, and check everything works on an example repo, clone the Jest Playwright example repository and copy the contents of basic-ts to a local folder of your own, like apps-pdv.
Then, in the terminal:
- Navigate to the root of your folder (which includes the copied
basic-tscontents) - Run
npm installto install all dependencies frompackage.json - Run
npm run test
This will run the Jest scripts in package.json, and the tests included in the example repository should pass and show results in your terminal!
Once the dependencies were installed, we were ready to improve the config files. If you're new to config files, here are some useful links:
- The official Playwright docs
- "Getting Started with Playwright"
- "Start UI Tests with Playwright"
- "Video: Playwright Test Runner"
And to give you some examples, here are our versions:
// package.json
{
. . .
 "scripts": {
 "test": "jest --detectOpenHandles",
 "test-debug": "PWDEBUG=1 jest --detectOpenHandles --debug"
 . . .
 },
 "devDependencies": {
 "@playwright/test": "^1.21.1",
 "@testing-library/jest-dom": "^4.2.4",
 "@types/jest": "^27.4.1",
 "@types/node": "^15.6.1",
 "@types/request": "^2.48.5",
 "dotenv-flow": "^3.2.0",
 "jest": "^27.5.1",
 "jest-image-snapshot": "^4.5.1",
 "jest-junit": "^13.1.0",
 "jest-playwright-preset": "^1.7.0",
 "playwright": "^1.19.2",
 "playwright-expect": "^0.1.2",
 "request": "^2.88.2",
 "ts-jest": "^27.0.2",
 "typescript": "^4.3.2"
 },
}
// tsconfig.json
{
"compilerOptions": {
"target": "es2019",
...
},
}// jest-playwright.config.js
module.exports = {
browsers: ['chromium'],
newErrorHandling: true,
launchType: "LAUNCH",
launchOptions: {
headless: true,
args: ['--disable-infobars', '--no-sandbox', '--disable-setuid sandbox']
},
use: {
trace: 'on',
screenshot: 'retain-on-failure',
video: 'on'
},
contextOptions: {
recordVideo: {
dir: './reports/'
}
},
retries: 2,
exitOnPageError: false
}//jest.config.js
/** @type {import('@jest/types').Config.InitialOptions} */ module.exports = {
verbose: true,
preset: 'jest-playwright-preset',
transform: { "^.+\\.tsx?$": "ts-jest" },
moduleFileExtensions: ["ts", "tsx", "js", "jsx", "json", "node"],
testTimeout: 120000,
reporters:
["default", "jest-junit"],
testResultsProcessor: "jest-junit"
}After the config files are built out, remember to run `npm install` again to update the new dependencies. We then moved onto improving the structure of our actual test files.
Here's an example:
import { expect } from "@playwright/test";
describe("Test case structure", () => {
 beforeAll(async () => {
  // executed before all test cases in this test suite, good for setup for all test cases
 });

 beforeEach(async () => {
  // executed before each test case in this test suite, good for setup for an individual test case
 });

 it("test case 1", async () => {
  // add your test case here
 });

 it("test case 2", async () => {
  // add your test case here
 });

 afterEach(async () => {
  // executed after each test case run, good for clean up
 });
 afterAll(async () => {
  // executed after all the test cases have run, good for the overall clean up
 });
});
3. Understanding Test Architecture: Page Object Model
We wanted the tests to be stable, readable, and easy to change, expand, and debug. However, Playwright is a new technology, and the documentation isn't totally comprehensive just yet. We've collated all the resources we found most helpful when getting our heads around the architecture, especially the Page Object Model:
- Page Object Models in Playwright (docs)
- General PageObject rules
- Why we recommend against the use of inheritance
Here's how the project file structure looks for our Microsoft Teams Jira Connector:
TeamsJiraConnector
- page
- mst-jira-cloud
- jira-client.page.ts
- global-level.view.ts
- mst-jira.frame.ts
- mst-teams
- teams-client.page.ts
- channels-view.view.ts
- mst-jira-cloud
- tests
- jira-side.test.ts
- jira-and-teams.test.ts
Here are a few additional tips and learnings we found helpful to develop, navigate and read page objects:
- Main pages use the
.pageextension. For instance, Jira client (jira-client.page) to login and navigate Jira using goTo methods. - Parts of pages should go in separate files with the
.viewextension. For example, Microsoft Teams Jira Connector global configuration page object which contains an iframe of the Marketplace app configuration page. - Frame objects should go in separate files with the
.frameextension. They represent the UI elements inside iframe of the 3rd party Atlassian application.
Important: don’t forget to use await – lots of mistakes can appear if it's missed.
Below you can see the way a frame object (MicrosoftTeamsJiraConnectorFrame) uses the page object (Jira system page) to execute actions inside an iframe where Microsoft Teams Jira Connector lives:
// global-level.view.ts
// Navigate to Jira System Settings and find Microsoft Teams Jira Connector page
export class GlobalLevel {
 public readonly mstFrame: MicrosoftTeamsFrame;
 private readonly page: Page;
 private readonly microsoftTeamsFrameSelector: string;
 ...

 constructor(page: Page) {
 this.page = page;

 this.microsoftTeamsFrameSelector = "//iframe[contains(@id,  'jira-microsoft-teams-connector__jira-microsoft-teams-connector-admin page')]";
 this.mstFrame = new MicrosoftTeamsFrame(this.page, this. microsoftTeamsFrameSelector);
 }

 public async gotoGlobalLevelMicrosoftTeams(): Promise<void> {
 // actual navigation is here
 }
}
// mst-jira.frame.ts
import { FrameLocator, Locator, Page } from "playwright";
export class MicrosoftTeamsJiraConnectorFrame {
public readonly microsoftTeamsFrameLocator: FrameLocator;
private readonly page: Page;
constructor(page: Page, frameSelector: string) {
this.page = page;
this.microsoftTeamsFrameLocator = page.frameLocator(frameSelector);
}
public async createRuleClick(): Promise<void> {
// execute an action inside an iframe where Microsoft Teams Jira Connector lives
await this.microsoftTeamsFrameLocator
.locator("#btn-create-configuration").click();
}
}Our application integrates Microsoft Teams with Jira, and below are the test cases that run only on the Jira side:
// jira-side.test.ts

. . .
describe("Microsoft Teams on Jira global level", () => {
 let jiraClient: JiraClient;
 beforeAll(async () => {
  // loging into Jira before all test cases
  jiraClient = new JiraClient(page);
  await jiraClient.loginJira();
 });
 beforeEach(async () => {
 // navigate to the Global configuration page of Microsoft Teams Jira Connector
 await jiraClient.globalLevel
   .gotoGlobalLevelMicrosoftTeamsConnector();});
 it("Should be able to open create rules dialog", async () => {
  await jiraClient.globalLevel.mstJiraConnectorFrame
    .createRuleClick();
  // expects the dialog of Create Rule appears
 }
}
Here is an example of a Jira and Microsoft Teams interaction test case:
// jira-and-teams.test.ts
. . .
describe("Microsoft Teams notification", () => {
 let jiraClient: JiraClient;
 let microsoftTeamsClient: MicrosoftTeamsClient;
 beforeAll(async () => {
  jiraClient = new JiraClient(page);
  microsoftTeamsClient = new MicrosoftTeamsClient(page);
  await microsoftTeamsClient.loginMicrosoftTeams();
  await jiraClient.loginJira();
 });
 it("Verify that notification received inside Microsoft Teams", async () => {
  await jiraClient.gotoJiraUrl();
  await jiraClient.globalLevel
    .gotoGlobalLevelMicrosoftTeams();
  await jiraClient.globalLevel.mstFrame.createRuleClick();
  // create the rule  for notifications

  await microsoftTeamsClient.gotoTeamsURL();
  await microsoftTeamsClient.channelsView
   .goToTeamChannelByName("Public");
  // trigger notification for the created rule
  // assert that notification was received in the Teams channel
 });
 . . .
});
And finally, here's a demo of a test case execution by Playwright in Chromium browser. This test verifies that notification has been received inside Microsoft Teams:

4. Remote Test Execution (When and Where to Run Tests)
Our tests were close to ready, so we needed to think about how to execute them. We had to take the following point into consideration:
- Our plugin Advanced Microsoft Teams Jira Connector actually consists of three different GitHub repositories – one for the Microsoft Teams side, one for the Jira Cloud side functionality, and one for the Jira Data Center side functionality. We wanted to automatically run tests when there were any changes in these repositories.
- We didn't want to have test cases duplications between Jira Cloud and Data Center when they can be covered by single independent of the Jira environment test case.
- We want for post deployment verifications to be independent of the environment they run on and the application versions installed there, so that we can execute them in multiple stages (dev, test, prod).
Our solution was to have all PDV tests development and execution independent from the Atlassian apps. Configure CI/CD pipelines specifically for the tests to be executed after each deployment of the Atlassian or Microsoft Teams application and run during the nightly builds. You can read more about CI in the Playwright docs.
We use CircleCI for CI/CD. Here's an example of our CircleCI pipeline:
version: 2.1
jobs:
 build:

docker:
 - image: mcr.microsoft.com/playwright:focal
. . .
 - run:
 name: Execute pdv tests
 command: |
 node pdv-environment.js --app="<< pipeline.parameters.app  >>" --instance="<< pipeline.parameters.instance >>" --stage="<<  pipeline.parameters.stage >>"

 - store_artifacts:
 path: ~/repo/html-report
. . .

parameters:
 app:
 type: string
 default: mst-jira
 instance:
 type: string
 default: cloud
 stage:
 type: string
 default: prod
. . .
But…how do we make tests hot reload or start running automatically after any changes in a native app repo?
Don't worry, we thought this through. You can update the CI/CD pipeline in each application repository with a step that starts executing the PDV test pipeline, and even passes in the necessary parameters. Here is gist of Atlassian application build and deployment pipeline:
 steps:
 - run:
 name: Start PDVs pipeline
 command: |
 curl -X POST https://circleci.com/api/v2/project/github /moveworkforward/all-apps-pdv/pipeline \
 --header "Circle-Token: $CIRCLECI_API_TOKEN" \  --header 'Content-Type: application/json' \  --header 'Accept: application/json' \
 -d '{ "parameters": { "app" : "mst-jira" ,  "instance" : "cloud" , "stage" : "prod" } }'
About the parameters
Parameters are important, because they tell the PDV tests which environment to test, and which test suite to run. For different environments, we actually use different test suites, so the parameters are important.
In the PDV repository, we created the pdv-environment.js file to process these parameters. The file is named .env.mst-jira.cloud.dev or .env.mst-jira.cloud.prod with environment variables, and exported/set to the shell. env.NODE_ENV variable. Each file contains app specific parameters – .dev for the test environment, and .prod for the production environment.
We use shell.js and commander packages to develop a command line tool which executes test cases for a specified via parameters app and environment.
// pdv-environment.js

const program = require("commander");
const shell = require("shelljs");
program
 .version("5.0.0")
 .option("-a, --app [app]", "Application to test")
 .option("-i, --instance [instance]", "Deployment type. cloud or  server")
 .option("-s, --stage [stage]", "App stage")
 .parse(process.argv);

shell.env.NODE_ENV = program.app + "." + program.instance + "." +  program.stage;
shell.exec(`npm run test`, function (code) { if (code !== 0) { shell. exit(1); } });
In the PDV repository pipeline, we execute the tests with the pdv-environment.js file and provided parameters:
node pdv-environment.js --app="<< pipeline.parameters.app >>" --instance="<< pipeline.parameters.instance >>" --stage="<< pipeline.parameters.stage >>"5. Environment Configurations
To write PDV tests, you need to prepare and pre-populate the environments of 3rd party applications (in our case, Jira Cloud and Microsoft Teams instances) with users and other test data. Each stage (personal, dev, test, and production) has its own Jira and Microsoft Teams instances and testing data, including user accounts.
It's important to remember that the content of your user data doesn't really matter – tests should be reusable and robust, meaning they can be executed anywhere, and not be reliant on environment data.
Our solution has been to use .env files with configured environment data:
- We used the dotenv-flow npm package
- We added the package on line 1 of the jest.config.js file:
require('dotenv-flow').config(); - We created a new file
.env.mst-jira.cloud.devfor the dev stage:
#.env.mst-jira.cloud.dev
# Teams credentials
TEAMS_USERNAME='...'
TEAMS_PASSWORD='...'
TEAMS_APP_NAME='DEV - Connector for Jira'
# Teams configured webhook info
WEBHOOK_URL='...'
TEAM='DEV'
CHANNEL='General'
# Jira credentials
JIRA_URL='...'
JIRA_ADMIN_LOGIN='...''
JIRA_ADMIN_PASSWORD='...'
JIRA_ADMIN_API_TOKEN='...'
JIRA_FRAME_SRC='...'
# Browser launch options
HEADLESS=true
SLOWMO=0- We created similar files for each combination of the environment and application under test
- We used the environment variables in test files wrapped in a TypeScript function.
- We ran the tests in the terminal, passing the param of specified environment:
NODE_ENV=mst-jira.cloud.dev npm run testNODE_ENV=mst-jira.cloud.prod npm run test
If you wanted to run the tests using the browser/GUI, you can either:
- Add the option to the jest-playwright.config.js file (if you want to use the GUI frequently):
const headlessOption = process.env.HEADLESS == 'true';
launchOptions: {
 headless: headlessOption,
},- Specifying the environment variable HEADLESS=false when calling the command (if you just want to try it once):
HEADLESS='false' NODE_ENV=mst-jira.cloud.prod npm test
6. Debugging: Understanding Why Tests Fail
In this section, we’ll identify three tools we found helpful for getting visibility into failed tests: the Playwright Inspector, video recordings, and viewing traces.
Playwright Inspector
We found Playwright Inspector extremely helpful to understand how our tests are executed step by step, for debugging, and to find out why tests have failed.

To run a test in "debug mode", you can add the test-debug script to the package.json:
"scripts": {
 "test": "jest --detectOpenHandles",
 "test-debug": "PWDEBUG=1 jest --detectOpenHandles --debug",
 "mst-jira-cloud:dev": "NODE_ENV=mst-jira.cloud.dev npm run test
 }
Now, you'd be able to call: NODE_ENV=mst-jira.cloud.prod npm run test-debug
Capturing video recording of tests
Another handy hint we learned was to record our tests by adding to the jest-playwright.config.js file:
// jest-playwright.config.js
 use: {
 video: 'on',
 ...
 },
 contextOptions: {
 recordVideo: {
 dir: './reports/videos'
 }
 },
Trace Viewer
Lastly, to help explore recorded Playwright traces, you can also add Trace Viewer, once again by adding to the jest-playwright.config.js file:
 // jest-playwright.config.js
 use: {
 trace: 'on',
 ...
 }
And then adding to the test file itself:
import { expect } from "@playwright/test";
describe("Test suite", () => {
 beforeAll(async () => {
 await context.tracing.start({ snapshots: true, screenshots:  true, sources: true });
 });

 beforeEach(async () => {
  await context.tracing.startChunk();
 });

 it("test", async () => {
  ...
 });

 afterEach(async () => {
  await context.tracing.stopChunk();
 });
});
Conclusion
We shared lessons learned developing Post-Deployment Verifications across different applications we didn't have direct control over (Atlassian Jira and Microsoft Teams), and reusing our test suites in different environments.
Implementing PDVs means we can deploy, test, and find out about problems quicker, and in an automated way. This helps us to be confident that the applications work well after each deployment.If you need help with integrating Microsoft Teams with Jira, or Github with Confluence, check out our products on Atlassian Marketplace.
If you have any questions or suggestions, you can reach out to Mariia on LinkedIn.